ARM DS-5 Quick Start (i.MX6): Unterschied zwischen den Versionen
en>Peter K 1 Version importiert |
Peter (Diskussion | Beiträge) K 1 Version importiert |
(kein Unterschied)
| |
Aktuelle Version vom 31. Oktober 2023, 10:03 Uhr

The reference software development tool suite for ARM processors
Developed by ARM Architecture experts, the ARM DS-5™ toolchain enables engineers to develop robust and highly optimized embedded software for ARM application processors, such as the Cortex™-A series, Cortex-R real-time processors and other ARM embedded processors. The DS-5 toolchain comprises tools such as the best-in-class ARM C/C++ Compiler, a powerful Linux/Android™/RTOS-aware debugger, the ARM Streamline™ system-wide performance analyzer and real-time system model simulators, all conveniently packaged in a user friendly integrated development environment (IDE) based on the Eclipse.
Introduction
This is a quick start for ARM DS-5 software, DSTREAM debugging hardware, and Bluetechnix CM-i.MX6 Quad/Dual/Solo.
This document is not exhaustive, please refer to the Further reading chapter how to retrieve documentation about DS-5.
What you will need
- ARM DS-5 software for Linux or Windows
- ARM DSTREAM Debug and Trace unit (optional)
- Ethernet connection between host and target (optional)
What is supported
- DS-5 Community Edition
- Linux application debugging (gdbserver)
- Streamline™ system-wide performance analyzer
- DS-5 Professional Edition & DSTREAM
- Bare Metal Debug (via JTAG)
- Linux Kernel/Device Driver Debug (via JTAG)
- Tracing using the Cortex-A9 ETB (Embedded Trace Buffer) (via JTAG)
Install ARM DS-5
You may start with the free DS-5 Community Edition, which is available at https://ds.arm.com/ds-5-community-edition/.
Evaluation licenses for the Professional Edition are available - see https://ds.arm.com/downloads/.
U-Boot debugging with DSTREAM
DS-5 and DSTREAM are used to initialize the i.MX6 target (including SDRAM), load the U-Boot ELF file to the target's memory, and debug/trace it.
You can download the initialization scripts for CM-i.MX6 from https://support.becom-group.com/releases/imx/mx6/ds-5/.
- cmimx6dq_mmdc_ddr3_init.ds for the Quad- or Dual-Core processor
- cmimx6s_mmdc_ddr3_init.ds for the Solo processor
How to create a proper debug configuration.
- Click Run from the menu and choose Debug Configurations....
- Right-click on DS-5 Debugger and click New.
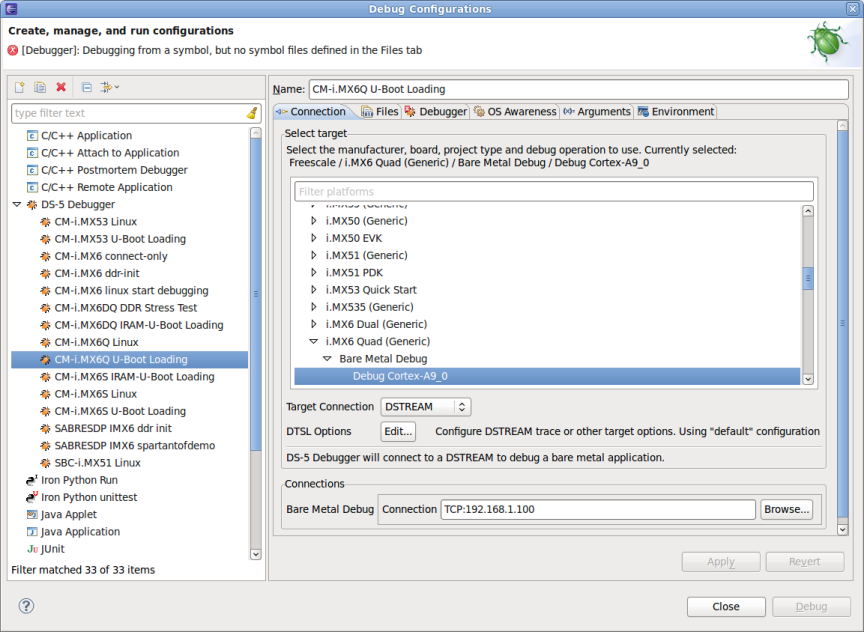
- On the Connection tab, in the Select target area, select one of the following, depending on the number of ARM cores your modules has.
- Freescale → i.MX6 Quad (Generic)
- Freescale → i.MX6 Dual (Generic)
- Freescale → i.MX6 Solo (Generic)
- Select Bare Metal Debug → Debug Cortex-A9_0.
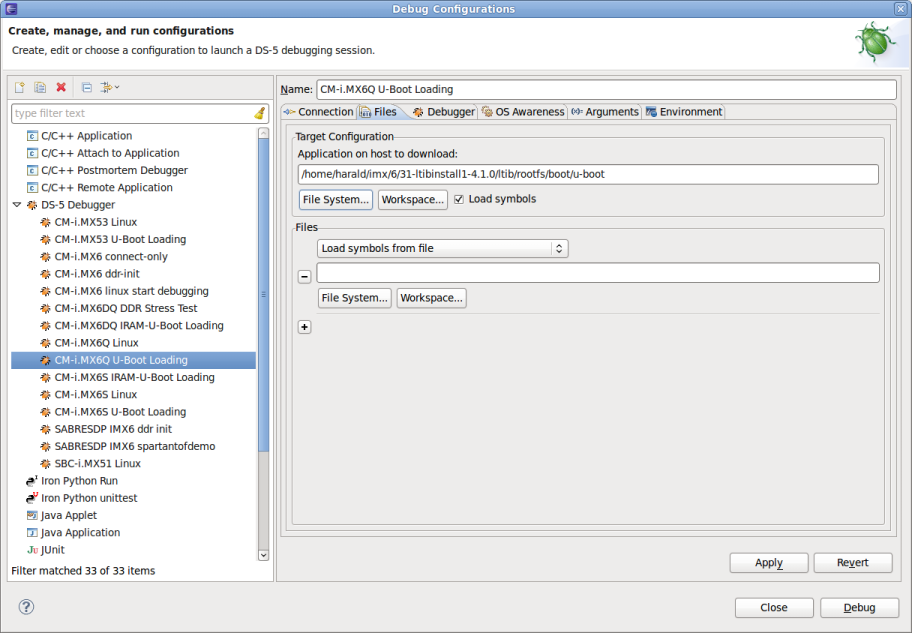
- Open the Files tab.
- Select the U-Boot ELF file u-boot (from LTIB's rootfs) as application to download, and check the Load symbols box.
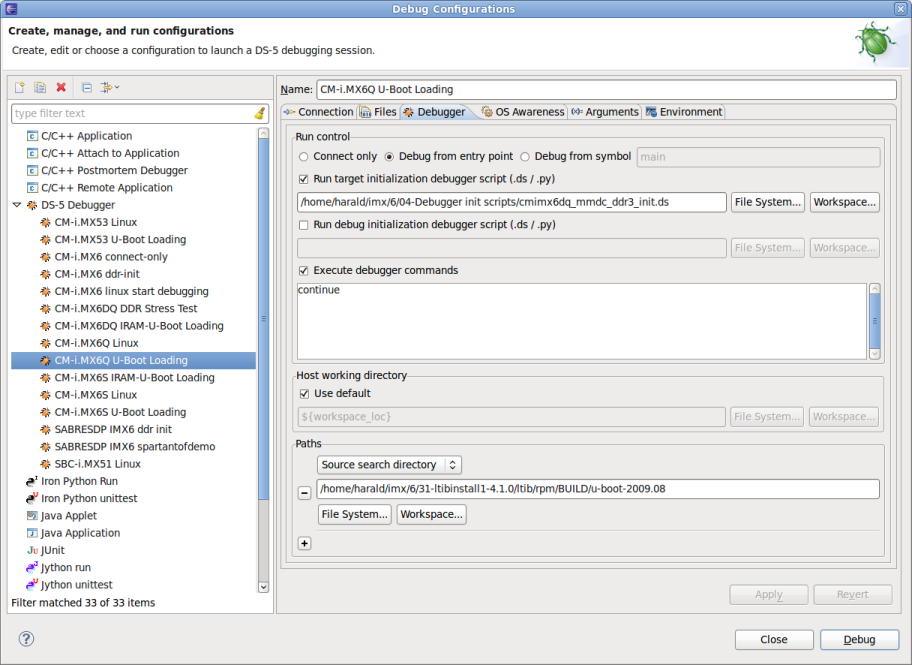
- Now open the Debugger tab.
- Select Debug from entry point.
- Select Run target initialization debugger script, and choose file cmimx6xx_mmdc_ddr3_init.ds via the File System... button (file download link above).
- If you like U-Boot to start as soon as you start the DS-5 debugging session, put continue into the Execute debugger commands field.
- Finally, add U-Boot's source folder as a source search directory.
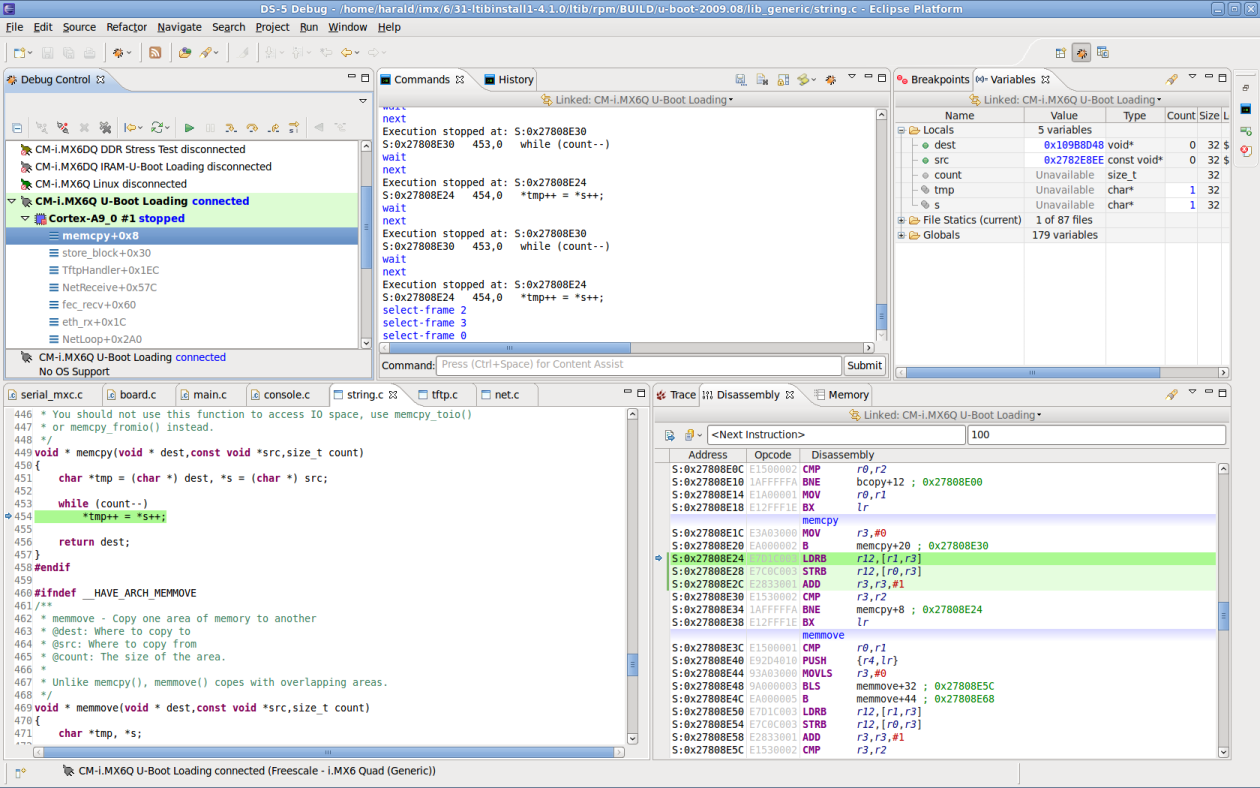
The following screenshot shows DS-5 while U-Boot debugging, in processor-stopped state.
Linux kernel debugging with DSTREAM
The default kernel configuration of the CM-i.MX6 includes the option to compile the kernel with debug info.
Kernel hacking -->
  [*] Kernel debugging
  [*] Compile the kernel with debug info
This will include symbol information for the debugger in the 'vmlinux' kernel executable.
Create a DS-5 debug configuration
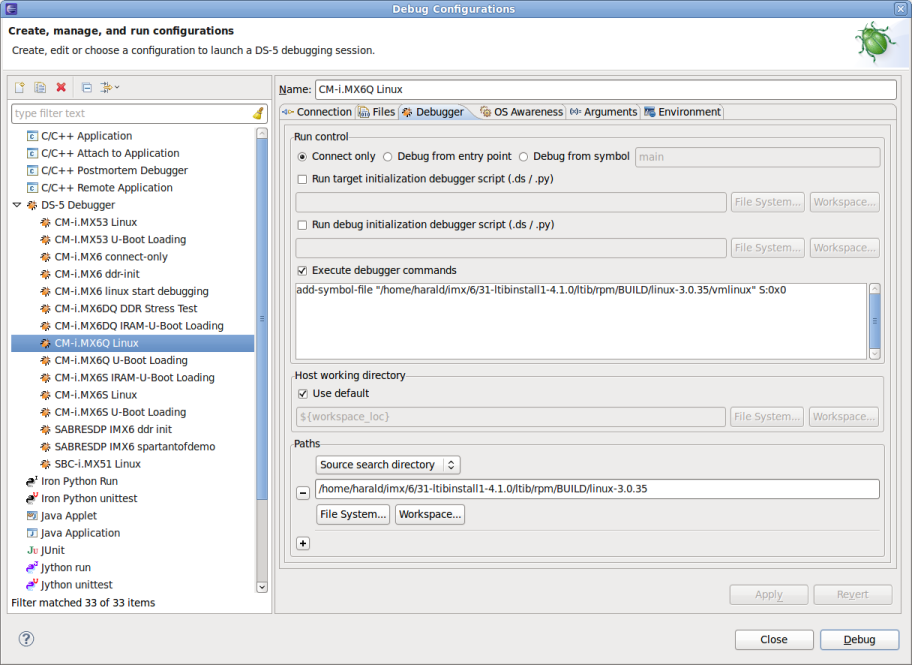
- Click Run from the menu and choose Debug Configurations....
- Right-click on DS-5 Debugger and click New.
- On the Connection tab, in the Select target area, select one of the following, depending on the number of ARM cores your modules has.
- Freescale → i.MX6 Quad (Generic)
- Freescale → i.MX6 Dual (Generic)
- Freescale → i.MX6 Solo (Generic)
- Select Linux Kernel and/or Device Driver Debug → Debug Cortex-A9x4 SMP.
- Go to the Debugger tab within the debug configuration.
- In the Files area, select Load symbols from file and add the file 'vmlinux' from LTIB's rpm/BUILD/linux/ directory.
- Check Execute debugger commands and add the command
add-symbol-file "<LinuxSourceDir>/vmlinux" S:0x0
- below. (Replace <LinuxSourceDir> with your kernel's source directory, which usually is ltib/rpm/BUILD/linux/.)
- In the Paths area, add the Linux kernel's source directory as Source search directory.
Debug Linux kernel code
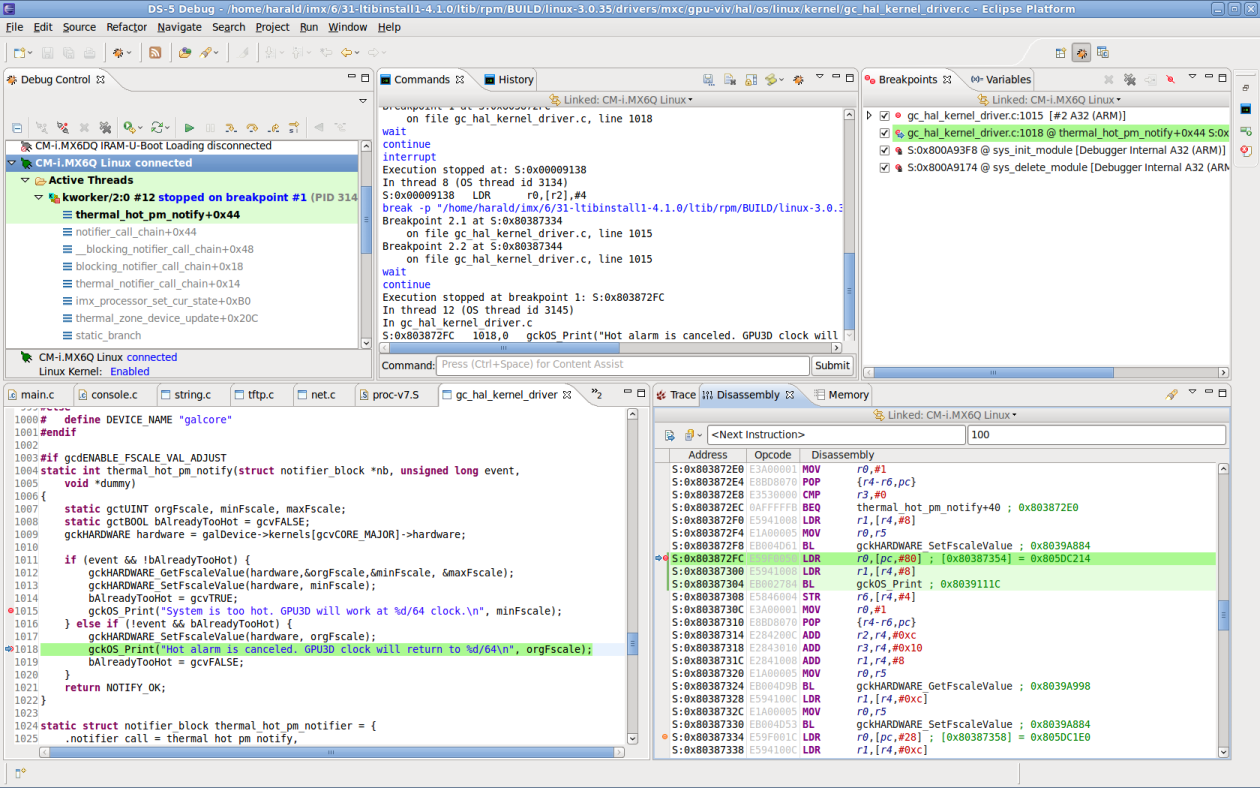
- Then, make sure your CM-i.MX6 has booted Linux, and click on 'Debug'.
- DSTREAM will now connect to the processor, but will not halt it. You can do this by pressing the yellow 'Pause' button in the 'Debug Control' view.
- Below is a screenshot of DS-5 after halting the processor at a breakpoint in the GPU kernel driver.
Debug a kernel module
Once DS-5 is connected to a target running Linux (Using the Linux Kernel and/or Device Driver Debug debugging target), it keeps track of all loaded kernel modules.
To view all loaded kernel modules, you have to open the Modules view in DS-5.
- From the menu, select Window, Show View, Modules.
To enable source-level debugging for a kernel module, you have to load the symbol information first. In our example, we want to debug the flexcan kernel module.
- We load the kernel module on the i.MX6 with the command
modprobe flexcan
- The kernel module now shows up in the Modules view. Note that the Symbol column contains 'no symbols', because DS-5 has no symbol information for this kernel module yet.
- We right-click into the Host File field of the flexcan module, and select Add Symbol File.
- We choose the appropriate .ko file (which is the kernel module) straight from the Linux kernel's build directory:
/home/harald/imx/6/31-ltibinstall1-4.1.0/ltib/rpm/BUILD/linux-3.0.35/drivers/net/can/flexcan.ko
- Now, the symbol information is loaded.
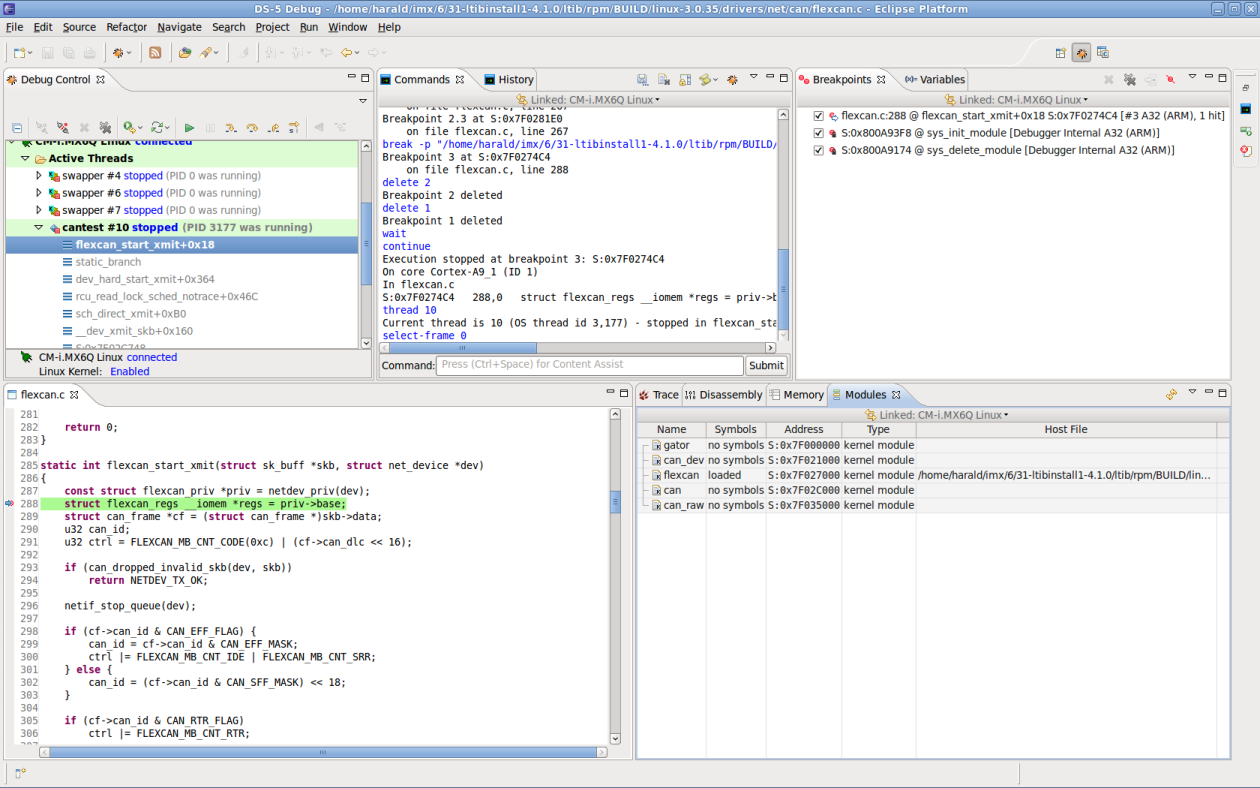
If we set a breakpoint e.g. into the flexcan_start_xmit() function, and send something on the CAN bus (via the Linux terminal), the breakpoint will be hit.
NOTE: All frequently execute steps can be fully automated with DS-5's scripting capabilities!
A short explanation of the screenshot below:
- Debug Control view: You can see that process 'cantest' stopped within the flexcan_start_xmit() function.
- Breakpoints view: The first breakpoint was set by us, the other breakpoints are automatically set by DS-5 to intercept kernel module loading/unloading.
- Modules view: You can see that the 'flexcan' module has symbol information loaded. The 'Host File' field contains the kernel module file.
Here is the link to ARM's Getting Started on Kernel modules debugging: [1]
Enable Tracing
DS-5 may use the on-chip ETB (Embedded Trace Buffer) of the i.MX6 to capture a small amount of real time trace data.
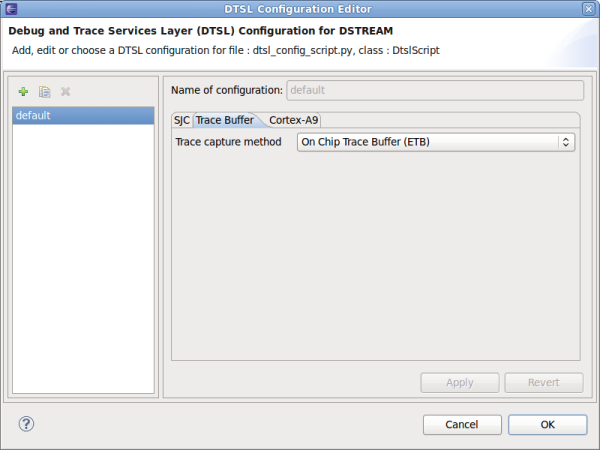
- In the debug configuration dialog, go to the Connection tab.
- Click the Edit... button for DTSL options.
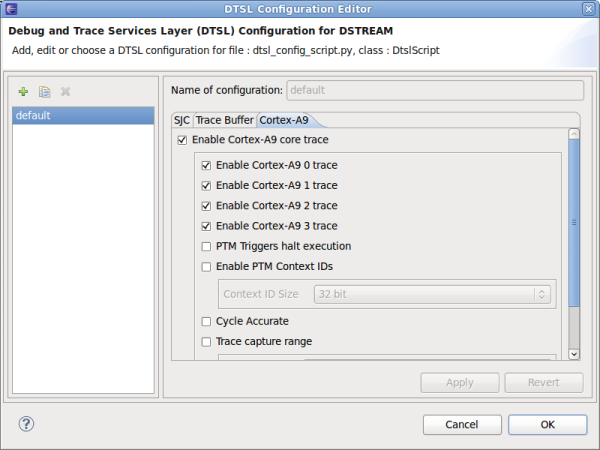
- In the DTSL (Debug and Trace Services Layer) Configuration Editor, tab Trace Buffer, set the Trace capture method to On Chip Trace Buffer (ETB).
- On the Cortex-A9 tab, enable trace for individual Cortex-A9 cores, and select other options according to your wishes.
- Click OK and Debug in the parent dialog to start debugging.
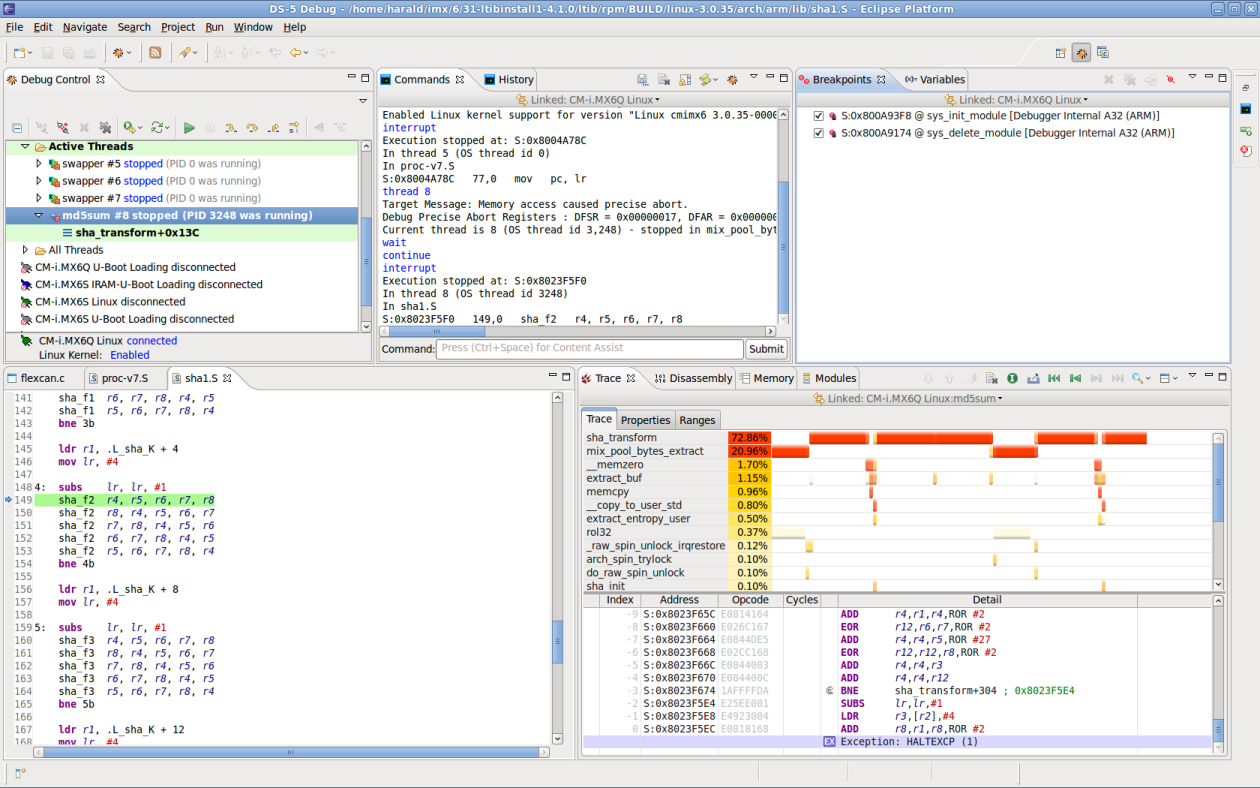
- If the processor is now halted, e.g. by a breakpoint, the Trace view updates with instruction trace and source-level function analysis.
- If the Trace view is not yet opened, select Window from the menu, Show View, and Trace.
The screenshot below shows the kernel code trace while the processor executes an instance of the md5sum application.
Using DS-5 Streamline
- Streamline works over an Ethernet connection.
- No JTAG connection nor debugger hardware is required.
- Supported by the DS-5 Community Edition.
Prepare the target
The CM-i.MX6 Linux BSP comes with Streamline support out of the box, this means,
- the Linux kernel is compiled with debugging options
- the gator kernel module is automatically installed,
- and the gatord daemon is automatically started at boot. You might notice the following message on the terminal:
Starting 'gatord' for ARM DS-5 Streamline
Be sure that your CM-i.MX6 is connected to the network and has a valid IP address.
Start streaming
- If the Streamline view is not visible in DS-5, open Window from the menu, and select Show View, Other....
- In the opened window, from folder ARM Streamline, select the Streamline Data view.
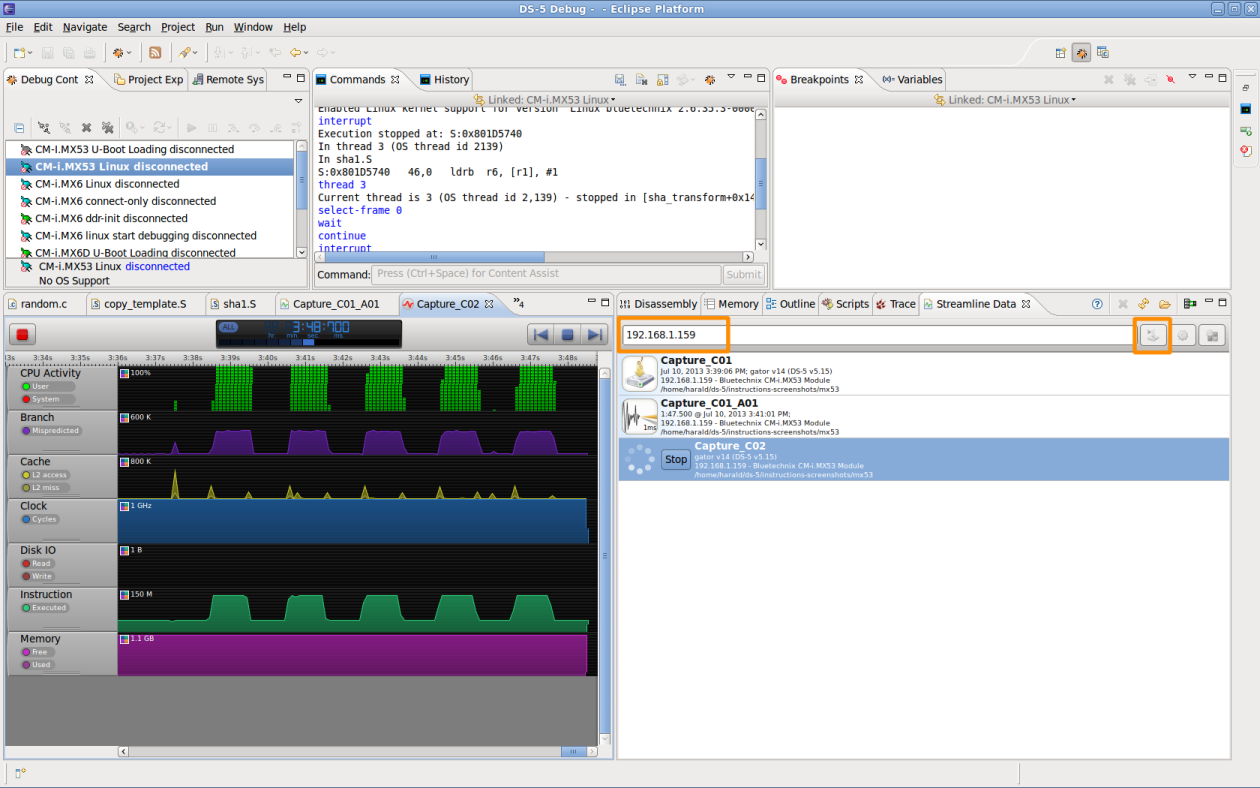
- Enter the IP address of your CM-i.MX6 in the top field of the Streamline view, and click the Start Capture button right of it. Choose a folder for storing the capture data afterwards.
- Now, you can see a live view of the running system, including CPU Activity, Memory usage, Disk I/O etc.
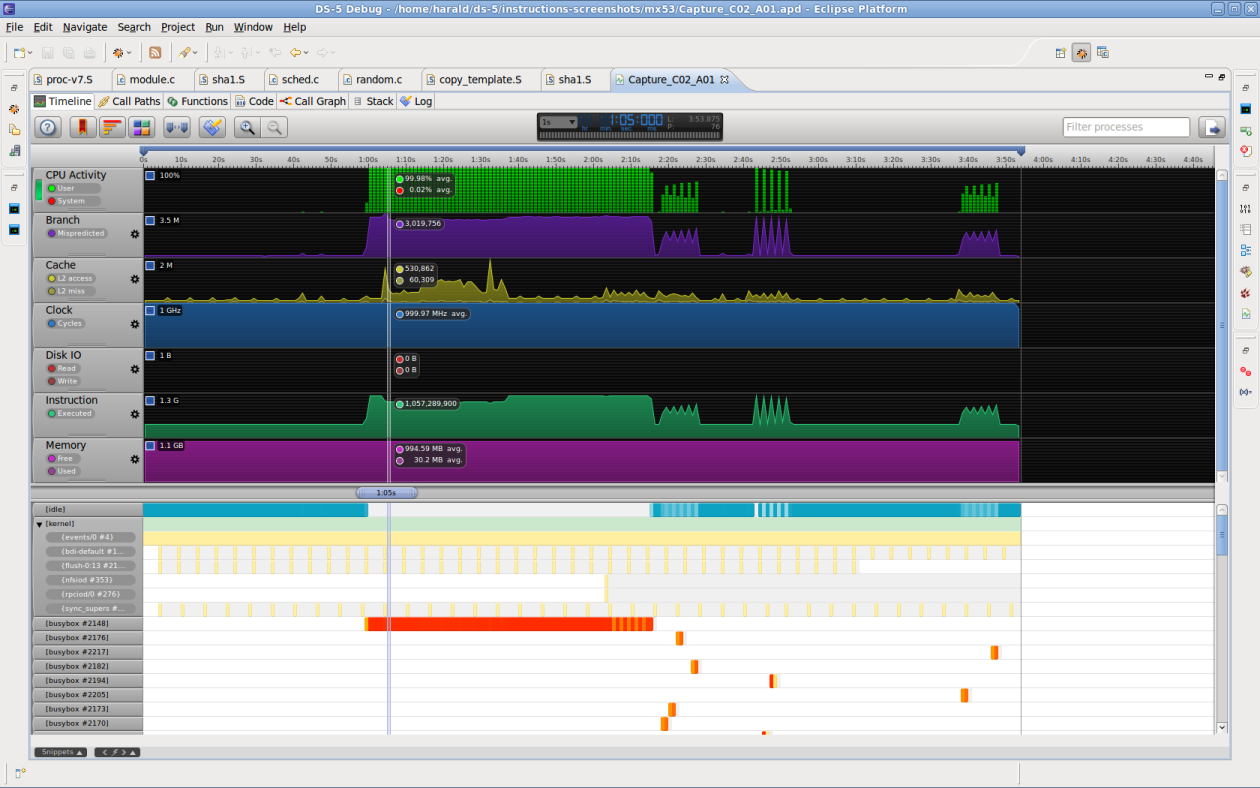
- After you have stopped streaming, you may analyse the data in the Capture_Cxx_Axx view.
Further reading
- ARM Infocenter for DS-5: https://infocenter.arm.com/help/index.jsp?topic=/com.arm.doc.subset.swdev.ds5/index.html
- ARM Infocenter for DS-5 Streamline: https://infocenter.arm.com/help/index.jsp?topic=/com.arm.doc.dui0482m/index.html
- ARM Infocenter for DSTREAM: https://infocenter.arm.com/help/index.jsp?topic=/com.arm.doc.subset.swdev.dstream/index.html
- DS-5 Community Edition: https://ds.arm.com/ds-5-community-edition/
- DS-5 Product Page: https://www.arm.com/products/tools/software-tools/ds-5/index.php
- DS-5 Downloads: https://www.arm.com/products/tools/software-tools/ds-5/ds-5-downloads.php
