Lauterbach ICD for i.MX53
The Lauterbach In-Circuit-Debugger supports Bluetechnix i.MX53 modules and boards.
Web site: https://www.lauterbach.com
Demonstration files
can be downloaded from our FTP server: Link
This contains several Trace32 batch files (*.cmm):
- demo.cmm: Based on Freescale Quick Start Board example
- ddrstresstest.cmm: DDR Stress test, including DDR2 configuration sequence
- u-boot.cmm: Load/attach to U-Boot and debug it
- linux.cmm: Load U-Boot, Linux kernel, with Lauterbach Linux Awareness
- linux-app-debug.cmm: Load U-Boot, Linux kernel, debug an application
Impressions
The Lauterbach ICD and the TRACE32 software supports Linux kernel awareness, and hence lets you debug
- Linux kernel
- Linux kernel modules
- Linux user space applications
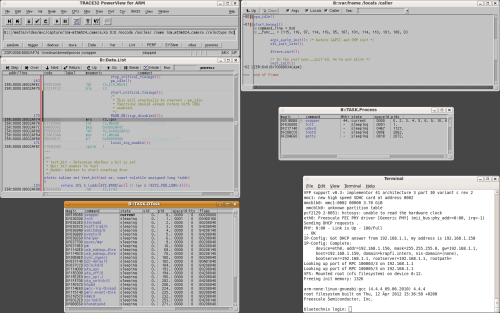
Here are some debugging impressions with Lauterbach JTAG Debugger and CM-i.MX53, debugging Linux:
Linux kernel debugging

Using linux.cmm batch file
The Linux kernel boots to the login prompt, then the debugger halts it.
B::Data.List is the code window, showing mixed C and assembly code from Linux's process.c file.
B::TASK.DTask shows a list of all Linux tasks.
B::var.frame shows stack frames.
B::TASK.Process shows Linux userspace processes.
Linux kernel module debugging
A kernel module (ism_mt9m025_camera) was loaded with the Linux Shell.
B::TASK.MODule shows a list of loaded kernel modules.
B::List shows the code of the module as it is loaded into RAM.
A breakpoint in the kernel module is set and hit.
B::sYmbol.Browse is the symbol browser and lets you find the function mt9m024_init_mode().
B::Break.List shows the breakpoints list.
B::Var.REF shows current variables in this function after hitting the breakpoint.
Linux application debugging
Using linux-app-debug.cmm batch file (and app_debug.cmm script)
Debugger is prepared for process start; process is started in terminal. Debugger detects process start and automatically halts in main().
B::Data.List shows application's code.
B::TASK.Process shows processes - hello is current.