ARM DS-5 Quick Start (SBC-i.MX51)

The reference software development tool suite for ARM processors
Developed by ARM Architecture experts, the ARM DS-5™ toolchain enables engineers to develop robust and highly optimized embedded software for ARM application processors, such as the Cortex™-A series, Cortex-R real-time processors and other ARM embedded processors. The DS-5 toolchain comprises tools such as the best-in-class ARM C/C++ Compiler, a powerful Linux/Android™/RTOS-aware debugger, the ARM Streamline™ system-wide performance analyzer and real-time system model simulators, all conveniently packaged in a user friendly integrated development environment (IDE) based on the Eclipse.
Introduction
This is a quick start for ARM DS-5 software, DSTREAM debugging hardware, and the SBC-i.MX51 single board computer.
This document is not exhaustive, please refer to the Further reading chapter how to retrieve documentation about DS-5.
What you will need
- ARM DS-5 software for Linux or Windows
- ARM DSTREAM Debug and Trace unit (optional)
What is supported
- DS-5 Community Edition
- Linux application debugging (gdbserver)
- Streamline is not supported currently
- DS-5 Professional Edition & DSTREAM
- Bare Metal Debug via DSTREAM
- Linux Kernel/Device Driver Debug via DSTREAM
- Tracing using the Cortex-A8 ETB (Embedded Trace Buffer)
Install ARM DS-5
You may start with the free DS-5 Community Edition, which is available at https://ds.arm.com/ds-5-community-edition/.
Evaluation licenses for the Professional Edition are available - see https://www.arm.com/products/tools/software-tools/ds-5/ds-5-downloads.php.
Adding target support
If your version of DS-5 does not have support for the SBC-i.MX51 yet, you can add a User Configuration Database.
How to check
- Start DS-5.
- Click Run from the menu and choose Debug Configurations....
- Right-click on DS-5 Debugger and click New.
- On the Connection tab, in the Select target area, search for Bluetechnix → SBC-i.MX51.
- If the target is not available, proceed.
Add support
- Download a ZIP file with the Configuration Database Entry from https://support.becom-group.com/releases/imx/sbc-imx51/ds-5/.
- Unpack the ZIP file.
- Open DS-5.
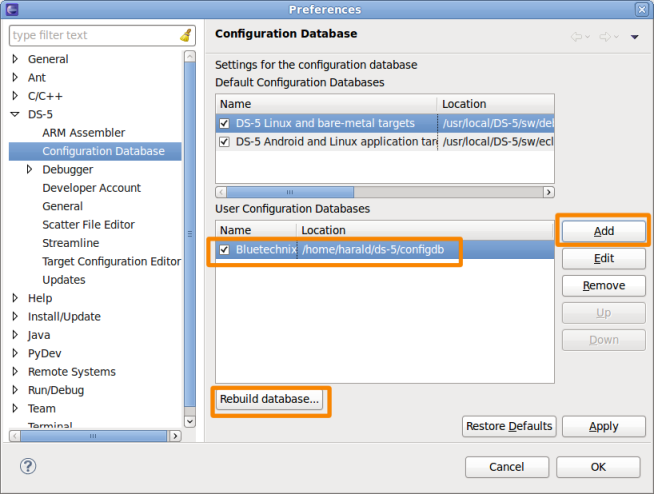
- Click Window from the menu and choose Preferences.
- On the left, expand the DS-5 configuration item and select Configuration Database.
- In the User Configuration Databases area, click on Add, and select the configdb folder from the unpacked ZIP file.
- Click on the Rebuild database... button. You are finished!
Compile the kernel with debug info
This is required if you want to debug your kernel via JTAG using DSTREAM.
- Go to kernel directory
cd btmxc-linux/
- Configure the kernel
source set-cross-envs
make menuconfig
- Enable the following options in the Kernel hacking menu:
[*] Kernel debugging
[*] Compile the kernel with debug info
- Rebuild and deploy the kernel
Configure Redboot
In order to allow JTAG access while the Linux kernel is running on the target, you have to tell the kernel with the following argument
jtag=on
To accomplish this,
- Reset or boot the SBC-i.MX51 with the serial terminal connected and ready.
- Stop booting with \sc{Ctrl-c}.
- Enter
fconfig
- Accept all entries except the 'Boot script' entry. Set it to:
e -b 0x100000 -l 0x300000 -c "console=ttymxc0,115200 console=tty1 root=/dev/mmcblk0p1 psplash=false rootwait display=hdmi:1024x768M-16@60 jtag=on"
(Your kernel arguments may vary - copy them and add jtag=on.)
- Don't forget to save the configuration in the last step of fconfig.
- Reset
reset
Create a DS-5 debug configuration
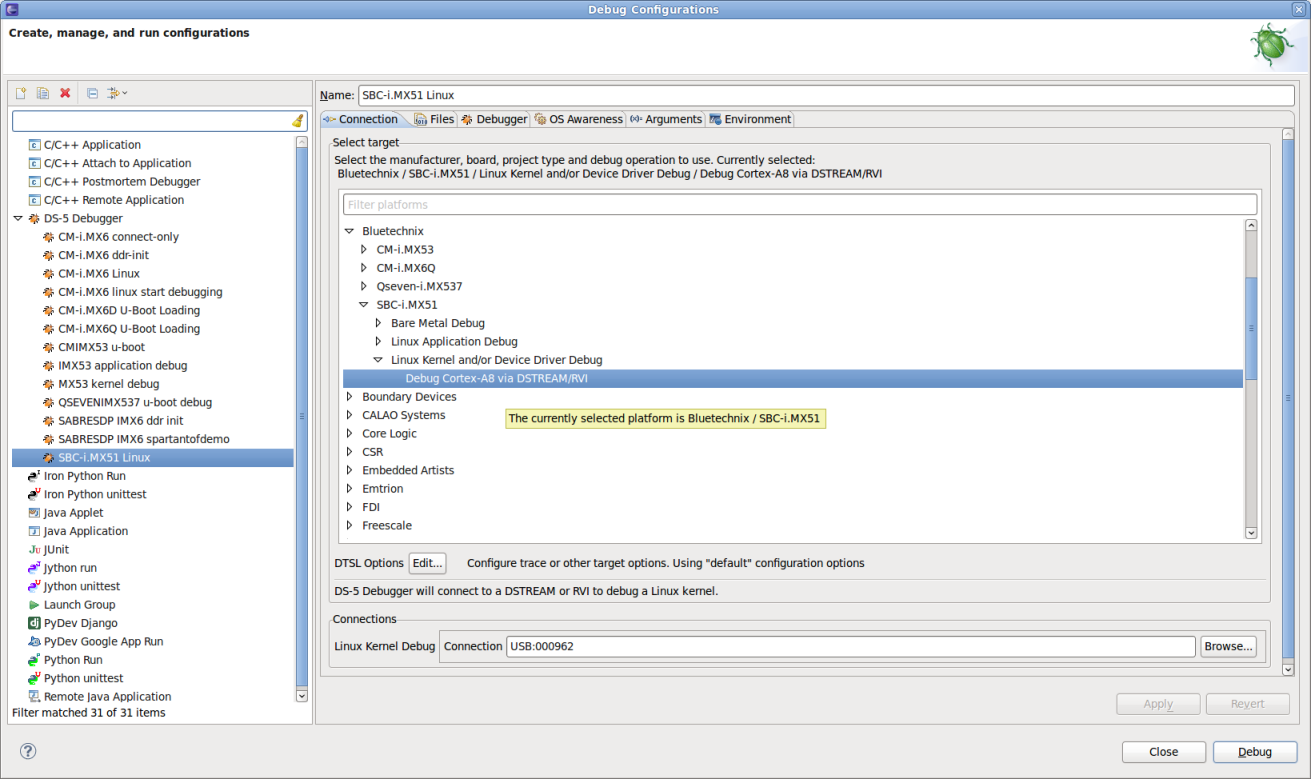
- Click Run from the menu and choose Debug Configurations....
- Right-click on DS-5 Debugger and click New.
- On the Connection tab, in the Select target area, select Bluetechnix → SBC-i.MX51.
- Choose between available debug targets.
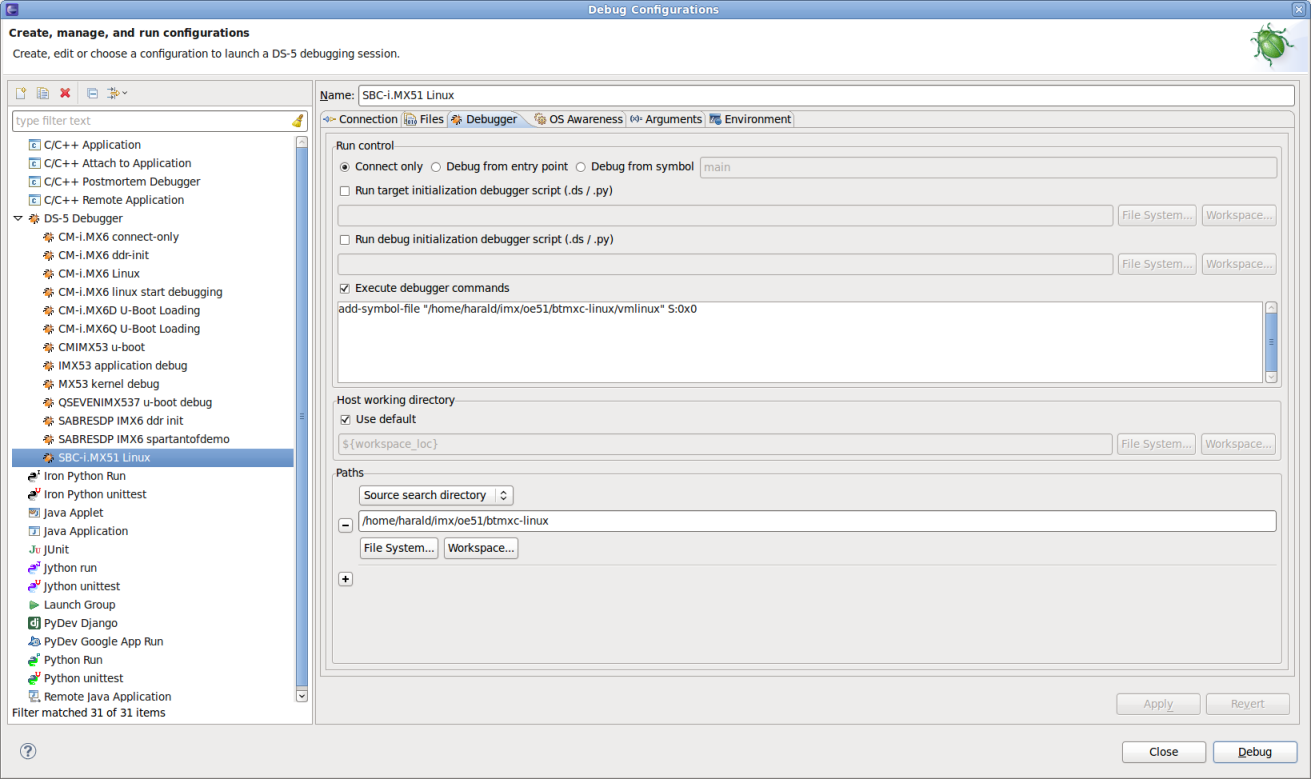
- For a kernel debugging session, you have to add a debugger command and add a source search directory in order to enable source-level debugging.
- Go to the Debugger tab within the debug configuration.
- Select Execute debugger commands, and add
add-symbol-file "<your-path>/vmlinux" S:0x0
- Add the directory where your Linux kernel sources are as a Source search directory.
Enable Tracing
DS-5 may use the on-chip ETB of the i.MX51 to capture a small amount of real time trace data.
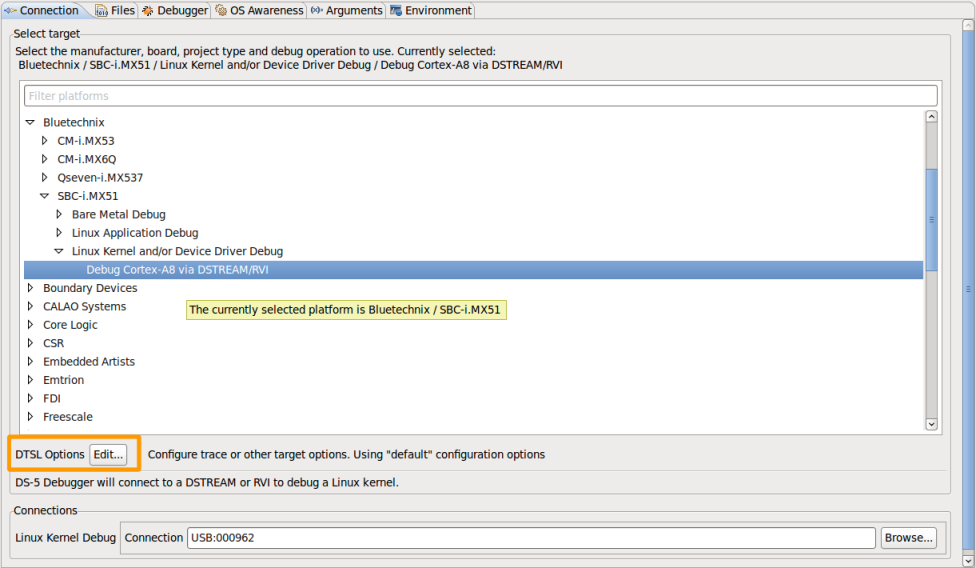
- In the debug configuration dialog, go to the Connection tab.
- Click the Edit... button for DTSL options.
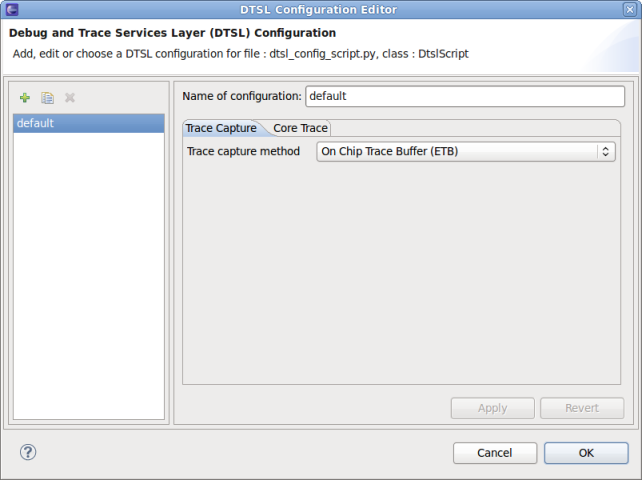
- In the DTSL (Debug and Trace Services Layer) Configuration Editor, set the Trace capture method to On Chip Trace Buffer (ETB).
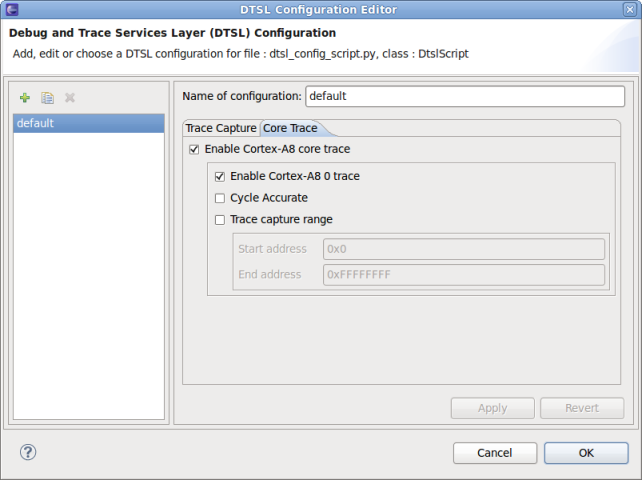
- On the Core Trace tab, enable Cortex-A8 trace, and select other options according to your wishes.
- Click OK and Debug in the parent dialog to start debugging.
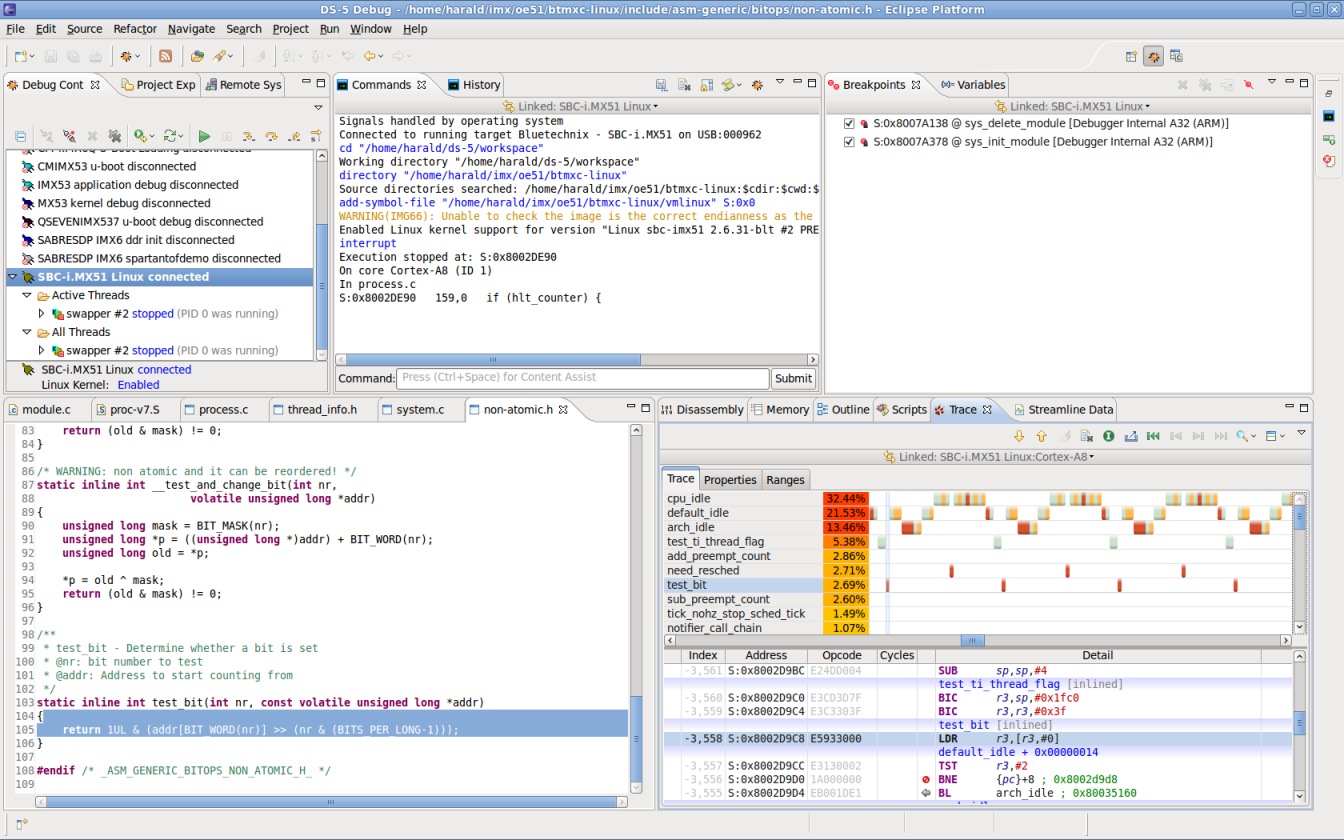
- If the processor is now halted, e.g. by a breakpoint, the Trace view update with instruction trace and source-level function analysis.
- If the Trace view is not yet opened, select Window from the menu, Show View, and Trace.
Further reading
- ARM Infocenter for DS-5: https://infocenter.arm.com/help/index.jsp?topic=/com.arm.doc.subset.swdev.ds5/index.html
- ARM Infocenter for DSTREAM: https://infocenter.arm.com/help/index.jsp?topic=/com.arm.doc.subset.swdev.dstream/index.html
- DS-5 Community Edition: https://ds.arm.com/ds-5-community-edition/
- DS-5 Product Page: https://www.arm.com/products/tools/software-tools/ds-5/index.php
- DS-5 Downloads: https://www.arm.com/products/tools/software-tools/ds-5/ds-5-downloads.php
